


Measles Vaccine, a real moneymaker out of nothing.
In 1962, a year marked by remarkable global changes and cultural transformations, astronaut John Glenn made history on February 20 by becoming the first American to orbit Earth in the Mercury spacecraft Friendship 7. This achievement represented a significant victory in the Space Race and highlighted the intense technological competition of the Cold War. Later that year, the Cuban Missile Crisis emerged—a fraught 13-day confrontation between the United States and the Soviet Union that nearly escalated into nuclear conflict, revealing the precarious nature of peace during the nuclear era. August brought shock and sorrow to the world with the unexpected death of Marilyn Monroe, the celebrated actress whose passing at just 36 years old led to widespread grief and ongoing debate about the circumstances of her suspected overdose.
The following year, 1963, would bring a highly anticipated medical breakthrough with the approval of the first widely administered measles vaccine in the United States. During 1962, measles was a frequent childhood disease, typically resolving on its own, though it sometimes caused serious complications and, in rare cases, death.
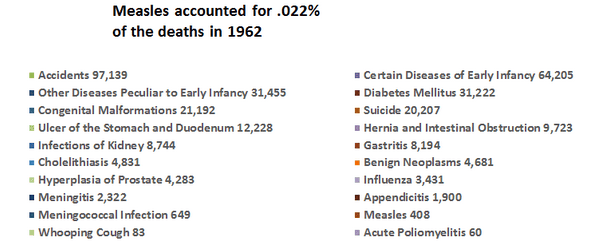
The chart above illustrates the primary causes of death in 1962. However, a more detailed examination reveals that these categories lack context and fail to capture the complexities involved. They focus on immediate causes but omit the wider social, economic, and systemic factors that influence mortality rates.
Measles, responsible for 408 deaths in 1962 and ranking 36th (accounting for only 0.022% of total deaths), occurred before the introduction of its vaccine, representing a minor portion of the chart. Of those 408 cases, serious malnutrition was involved in 70% of them.
In contrast, syphilis (ranked 30th with 2,811 deaths, or 0.15% of total mortality) and scarlet fever (ranked 38th, causing 102 deaths, about 0.006% of all deaths) are acute infectious diseases that seldom receive public attention, possibly because no vaccines are available for these illnesses.
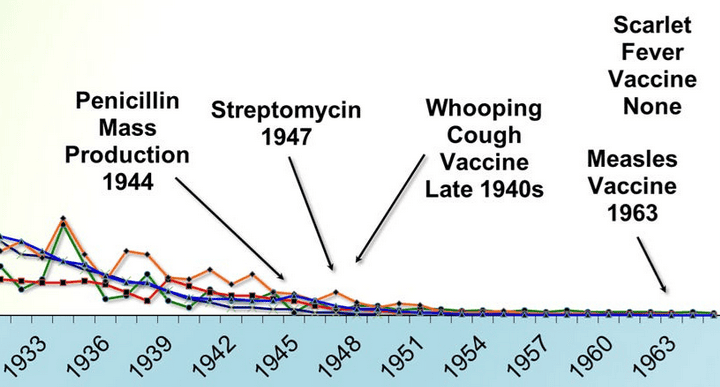
Despite vaccination efforts, whooping cough, diphtheria (for which the DTP vaccine was introduced in the late 1940s), and polio (with vaccines available since 1955) still claimed lives.
Tuberculosis is particularly significant, ranking 17th with 9,506 deaths (approximately 0.52% of total mortality). Although the BCG vaccine existed and was employed in various countries, it was never incorporated into routine immunization programs in the United States, partly due to doubts about its inconsistent effectiveness and a perception of low domestic risk.
Focusing specifically on the New England region—characterized by relatively high living standards and better healthcare access—measles mortality in 1962 was notably low, with just five deaths reported across all six states.
Connecticut reported zero deaths.
Maine had one death.
Massachusetts recorded no deaths.
New Hampshire reported zero deaths.
Rhode Island had one death.
Vermont accounted for three deaths.
When compared to the current urgent warnings about measles, these numbers are remarkable. The data from 1962 indicate that by the early 1960s—before the vaccine was introduced—measles mortality had already decreased considerably across many areas of the United States, particularly in wealthier regions such as New England. Enhancements in nutrition, sanitation, medical care, and living standards were crucial factors in lowering the death rate well before vaccines came into use.
Furthermore, these figures omit several vital factors contributing to mortality, such as medical mistakes, poor nutrition, poverty, environmental hazards, and systemic inequalities. By overlooking these fundamental health determinants, the pie chart reduces intricate causes of death into simplistic categories, prompting a crucial question: do these classifications accurately reflect the underlying reasons for mortality, or do they merely represent its ultimate manifestations?
It is important to highlight that public health reports often concentrate on the availability or absence of vaccines, rather than considering the broader context influencing health outcomes. This focus on isolated interventions can conceal the importance of comprehensive public health strategies that encompass access to healthy food, clean water, adequate housing, education, and quality medical care.
Examining mortality data from 1962 reveals that numbers alone cannot convey the entire narrative. Although the measles vaccine was introduced a year later in 1963, the previous year’s data illustrate a far more intricate scenario—with measles causing only a small proportion of deaths even before widespread immunization. This compels us to question the oversimplified stories commonly accepted and to delve deeper into the social conditions affecting health outcomes. Failing to consider the broader social, economic, and environmental influences on mortality risks distorting the true nature of the challenges we face and missing out on the most effective and lasting solutions.
1. Cardiovascular and Renal Diseases of Major Importance — 968,809 fatalities (53.20%)
2. Malignant Tumors — 278,562 fatalities (15.30%)
3. Accidental Deaths — 97,139 fatalities (5.33%)
4. Certain Early Infancy Diseases — 64,205 fatalities (3.53%)
5. Pneumonia — 56,564 fatalities (3.11%)
6. Other Various Diseases — 52,173 fatalities (2.87%)
7. Diseases Specific to Early Infancy — 31,455 fatalities (1.73%)
8. Diabetes Mellitus — 31,222 fatalities (1.71%)
9. Injuries During Birth — 28,199 fatalities (1.55%)
10. Liver Cirrhosis — 21,824 fatalities (1.20%)
11. Congenital Defects — 21,192 fatalities (1.16%)
12. Suicide — 20,207 fatalities (1.11%)
13. Other Pulmonary Diseases of the Bronchial Region — 20,072 fatalities (1.10%)
14. Symptoms Associated with Senility and Vague Conditions — 19,730 fatalities (1.08%)
15. Stomach and Duodenal Ulcer — 12,228 fatalities (0.67%)
16. Hernias and Intestinal Blockages — 9,723 fatalities (0.53%)
17. Tuberculosis — 9,506 fatalities (0.52%)
18. Homicides — 9,013 fatalities (0.49%)
19. Kidney Infections — 8,744 fatalities (0.48%)
20. Gastritis — 8,194 fatalities (0.45%)
21. Various Other Infectious Diseases — 5,791 fatalities (0.32%)
22. Asthma — 4,896 fatalities (0.27%)
23. Gallstone Disease (Cholelithiasis) — 4,831 fatalities (0.27%)
24. Benign Tumors — 4,681 fatalities (0.26%)
5. Bronchitis — 4,665 fatalities (0.26%)
26. Neonatal Infections — 4,551 fatalities (0.25%)
27. Prostate Hyperplasia — 4,283 fatalities (0.24%)
28. Influenza — 3,431 fatalities (0.19%)
29. Anemia — 3,398 fatalities (0.19%)
30. Syphilis — 2,811 fatalities (0.15%)
31. Meningitis — 2,322 fatalities (0.13%)
32. Appendicitis — 1,900 fatalities (0.10%)
33. Acute Nephritis — 1,572 fatalities (0.09%)
34. Complications During Delivery and Pregnancy — 1,465 fatalities (0.08%)
35. Meningococcal Disease — 649 fatalities (0.036%)
36. Measles — 408 fatalities (0.022%)
37. Dysentery — 323 fatalities (0.018%)
38. Scarlet Fever — 102 fatalities (0.006%)
39. Whooping Cough — 83 fatalities (0.005%)
40. Acute Poliomyelitis — 60 fatalities (0.003%)
41. Diphtheria — 41 fatalities (0.002%)